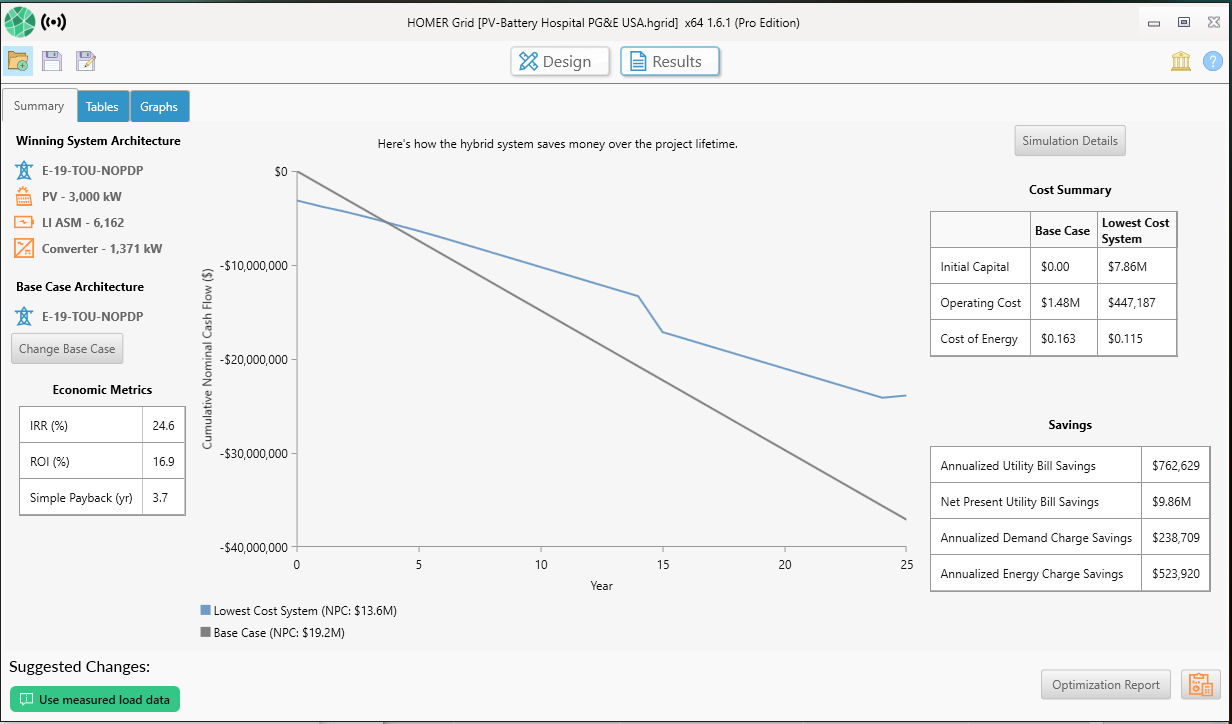
If you’re calculating a model with HOMER Pro or HOMER Grid, the first thing you’ll see is a Summary of one single simulation:
This simulation has the lowest net present cost, so it is displayed by default to give you an idea of the cost savings possible with a hybrid system.
The Summary Tab shows one single simulation, but HOMER simulated many more system architecture combinations and sizes. Navigate to the “Tables” tab in the Results view. By default, the Optimization Results table shows the systems ‘Categorized’ by the technology combinations (as shown in the image below).
The table sorts the simulations by the lowest Net Present Cost. The top row of the simulation has the lowest Net Present Cost and that is the system that’s displayed in the Summary Tab.
To sort and filter all the hundreds of simulations that have been run, click on ‘Overall’ table view, as opposed to ‘Categorized’. This will display a full list of simulations that have been run, and you can choose to sort and filter the simulations by some other variable than NPC. For example, if you wanted to find the system which would achieve the highest IRR, you can choose to sort based on that column.
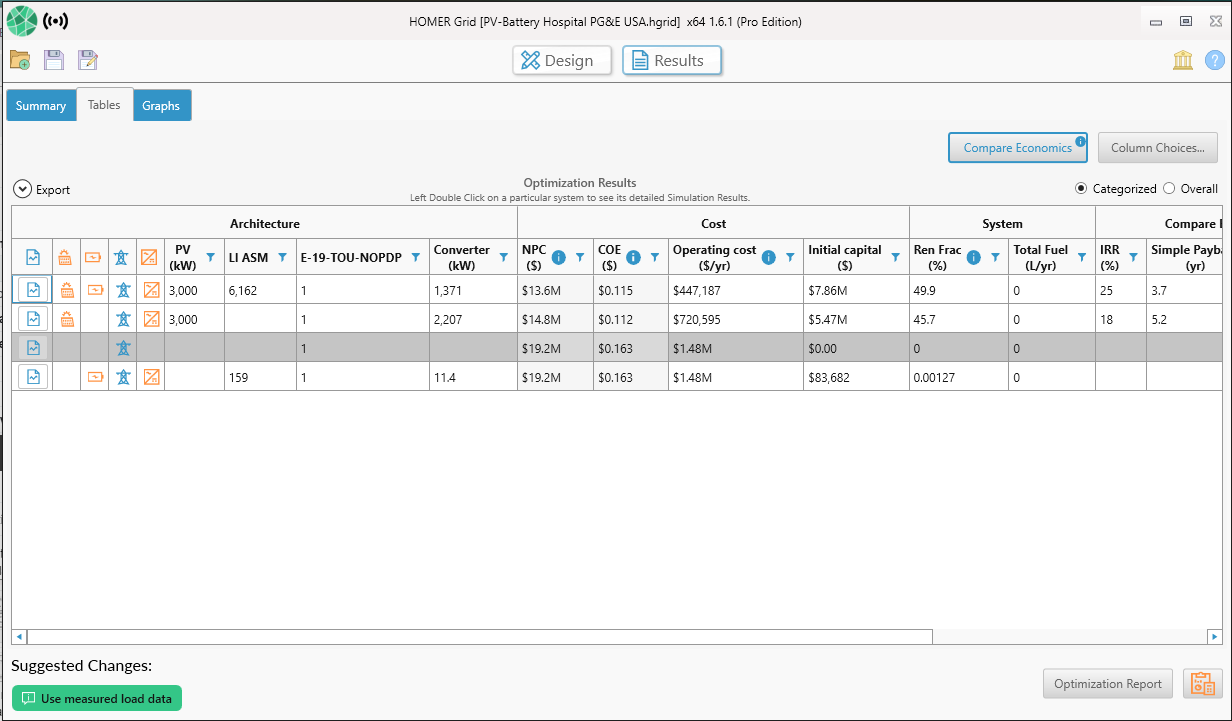
Double clicking on any one of the optimization results opens up important details about that particular system.
Learn about viewing results in HOMER Pro
Learn about viewing results in HOMER Grid
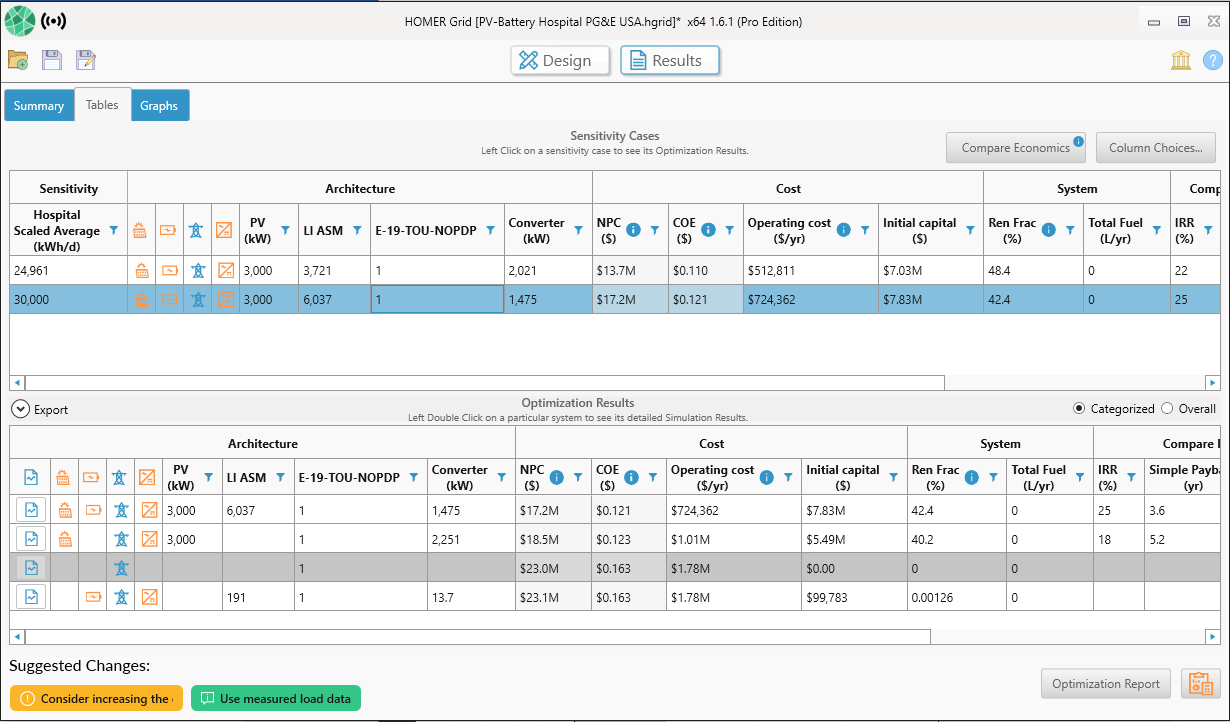
If you’re modeling with sensitivity variables, you’ll see two tables on the ‘Tables’ tab. The upper table is the Sensitivity Cases table and the lower table is the Optimization Results table (as shown in the image below).
By clicking on a row in the Sensitivity Cases table, you can see that the rows in the Optimization Results table changes. Select a sensitivity case that you’d like to consider, and then sort and filter the Optimization Results as described above. The simulation displayed in the Sensitivity Cases table is the lowest NPC simulation, i.e. the top row in the Optimization Results table.
HOMER displays the lowest NPC system in the Sensitivity Case table, so that you can see how the sensitivity variable impacts the lowest NPC system sizing, architecture, and costs.