
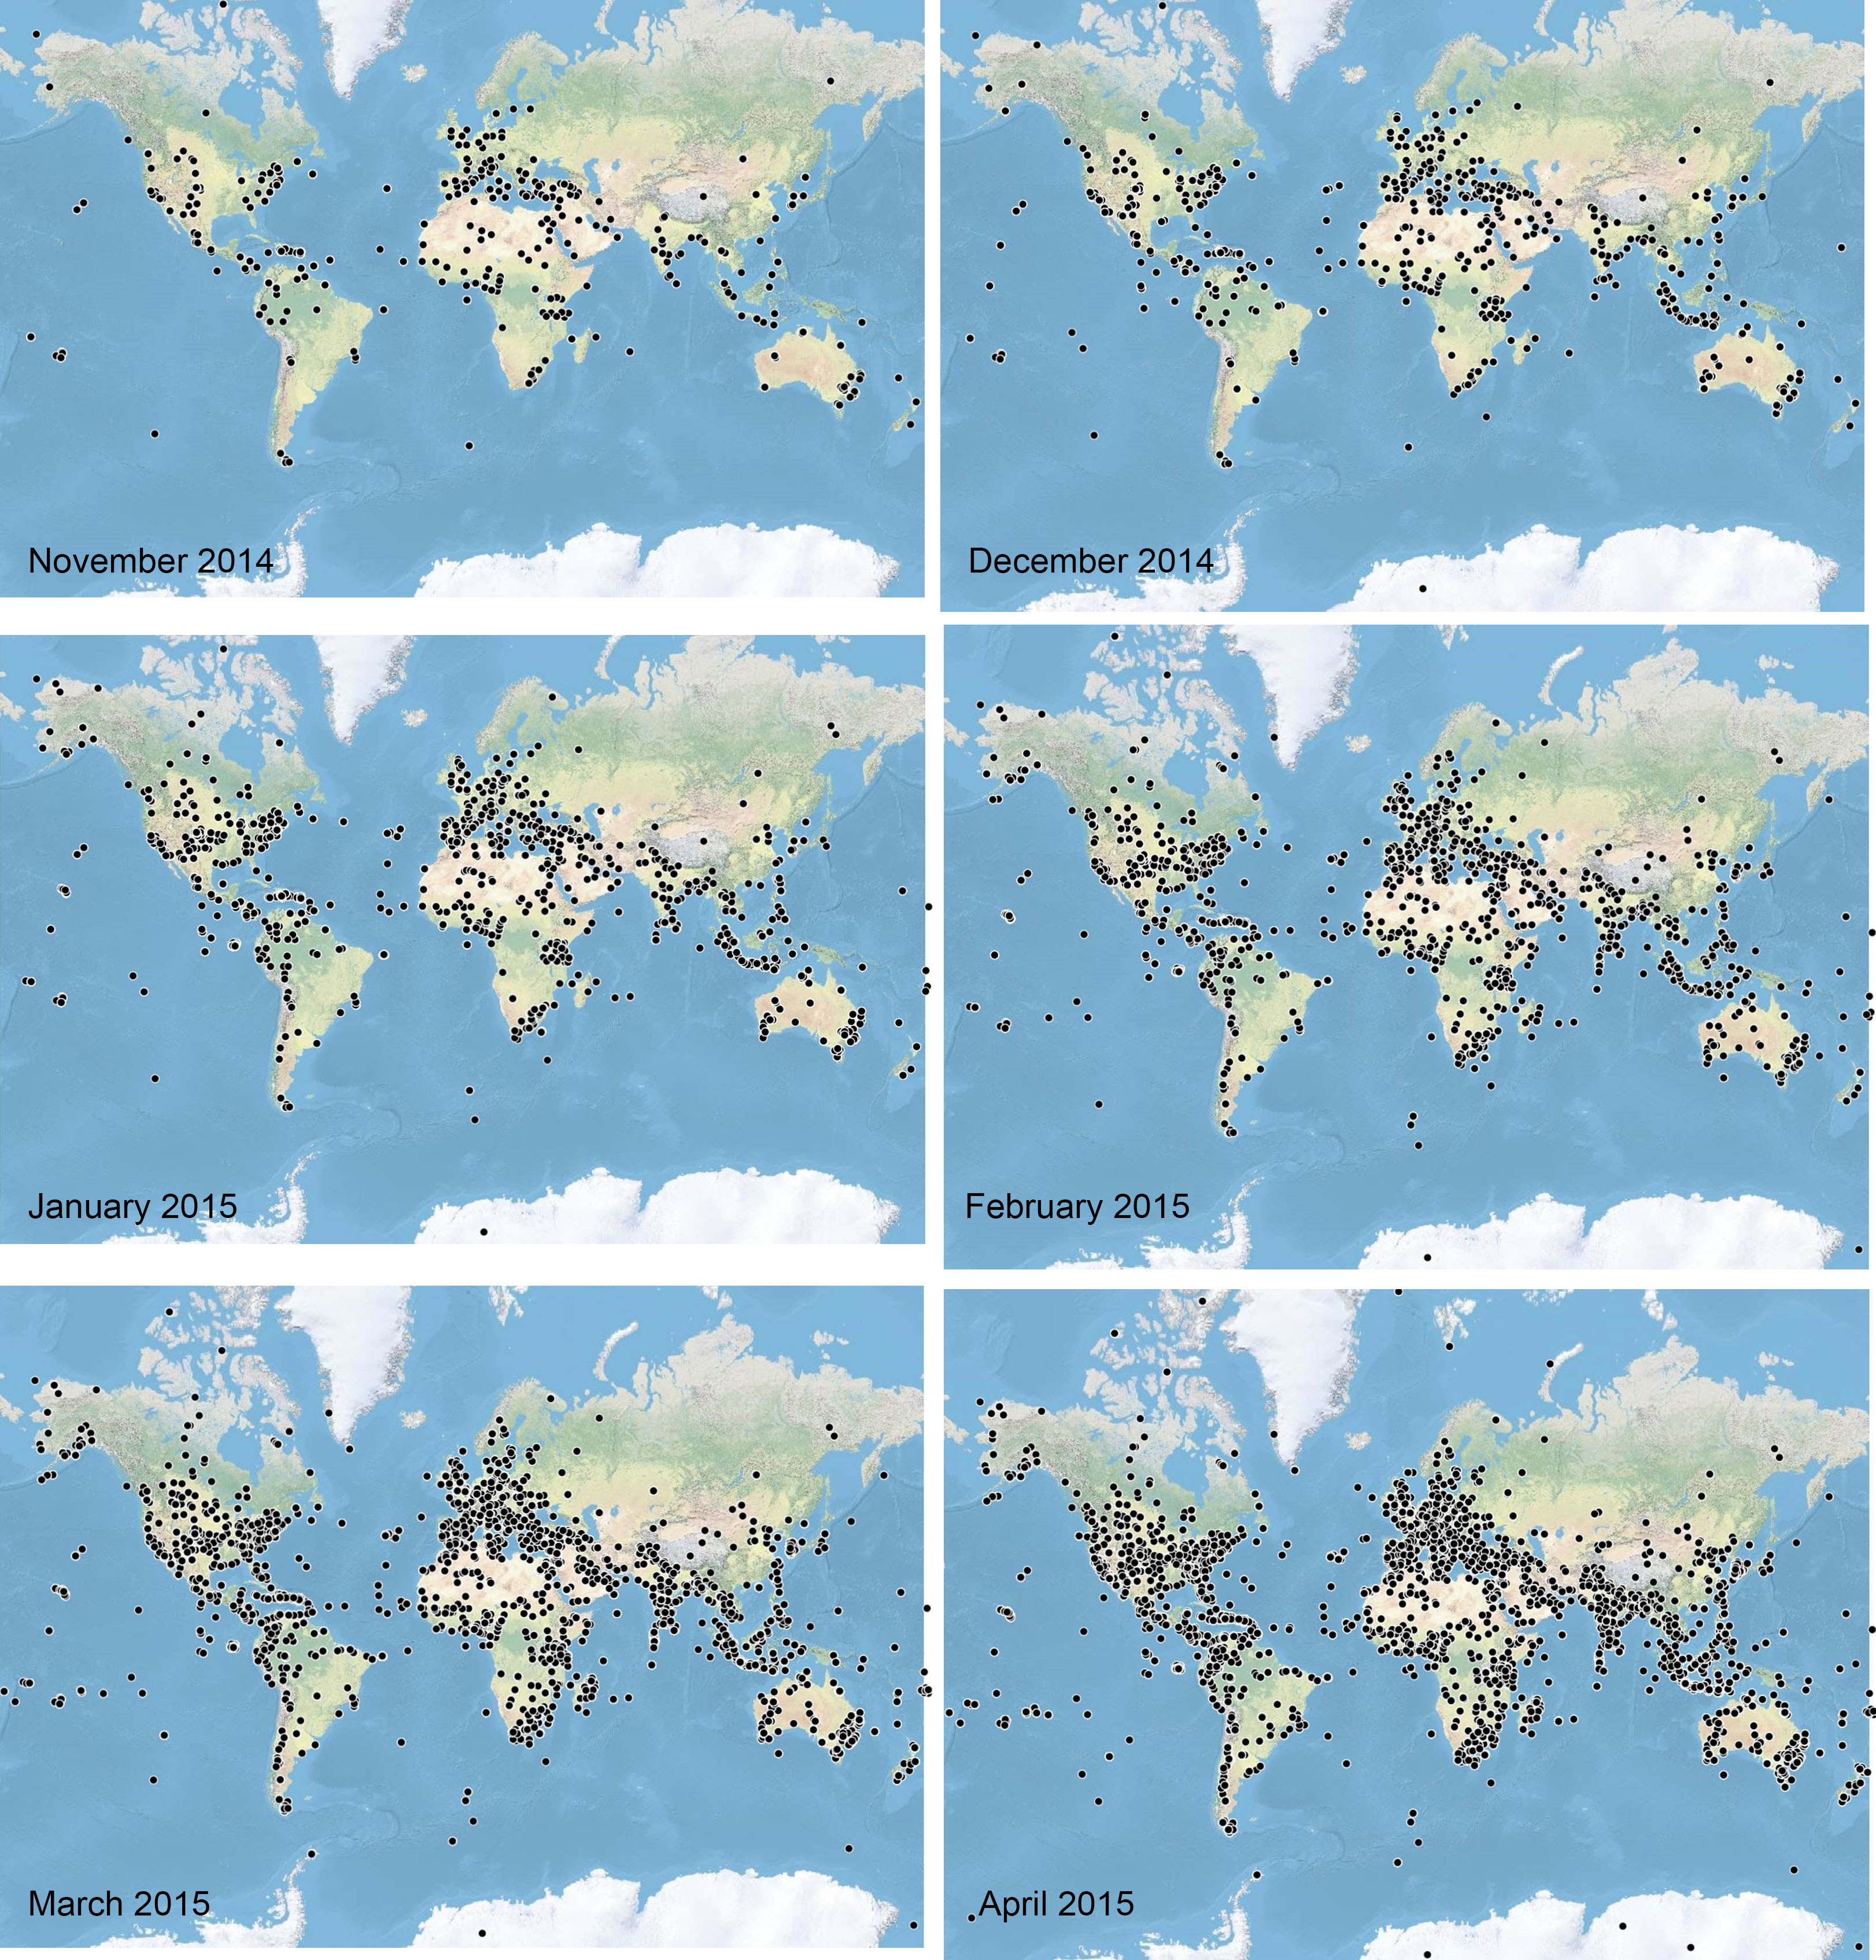
May 1, 2015 marked the 6-month point of our launch of HOMER Pro, and what a ride it has been. We knew that the product was catching on, as we watched our base of users grow. But I don’t think that any of us were prepared for the impact of seeing where people are using HOMER. We’ve often said, and heard, that HOMER is the global standard for microgrid assessment and design, and we know that it has been downloaded in every corner of the world. But just where are the potential microgrid and distributed generation projects that are being evaluated with HOMER? Everywhere – they are literally everywhere.
Our lead developer recently put together this series of maps showing all the places in the world where someone had used HOMER to evaluate a potential microgrid project. The images below show the growth of HOMER through the world more dramatically than I could ever explain with words or graphs. The upper left is month #1 of HOMER Pro’s release – November 2014. Each consecutive map adds the new locations for that month, ending in April 2015.
If you are a manufacturer of technology that can be explicitly defined in HOMER, imagine the power of knowing where in the world your technology is being modeled. There might be new markets you should consider. There might be places where you need to let people know they can use HOMER to evaluate the economics of your product. You could have access to maps like this, selected for your products only. (If that’s of interest, please contact our sales department who can explain how economical it is to get your products into HOMER.)
They say a picture is worth a thousand words, so I think this post is long enough. If you felt like you were alone somewhere using HOMER, you clearly were not!That’s because HOMER is used in every country in the world, and it is used to evaluate potential microgrid and hybrid distributed generation projects for every corner of the world.